Finance and Accounting
From Data to Decisions: How Smart Financial Dashboards Transform Business Growth

Teodora Inic
December 16, 2025
.png)
%20(1).png)
As your business grows, so does the volume of data surrounding it. Revenue streams expand, expenses scale, new tools are added, teams grow, processes shift — and suddenly, the financial picture becomes harder to read. At first, most companies try to manage this complexity through spreadsheets, fragmented reports, or periodic check-ins with accounting. And for a while, that works.
But there comes a point in every growing business where numbers alone aren’t enough.
What you need is clarity.
You need to know:
That’s where financial dashboards make the difference.
A financial dashboard is not just a reporting tool — it is a decision-making system.
When done right, it translates raw financial data into a visual narrative of your business: what’s healthy, what’s at risk, and where the biggest opportunities lie.
When done poorly, it becomes another confusing spreadsheet no one actually uses.
So how do you build a dashboard that leaders trust — and act on? Let’s break that down.
A truly effective financial dashboard does three core things:
Not last quarter. Not last month. Now.
This matters because the faster you see a problem, the faster you can correct it. Late reporting turns small issues into costly ones.
Your dashboard isn’t meant to show everything. It should show the few metrics that matter most to your business model.
For example:
Every business has different levers. Your dashboard should reflect that.
The point isn’t just to see numbers — it’s to act on them.
A strong dashboard answers:
This is where most businesses fall short. Their dashboards show data — but not direction
Let’s call out the reality: many dashboards look great but don’t actually help anyone.
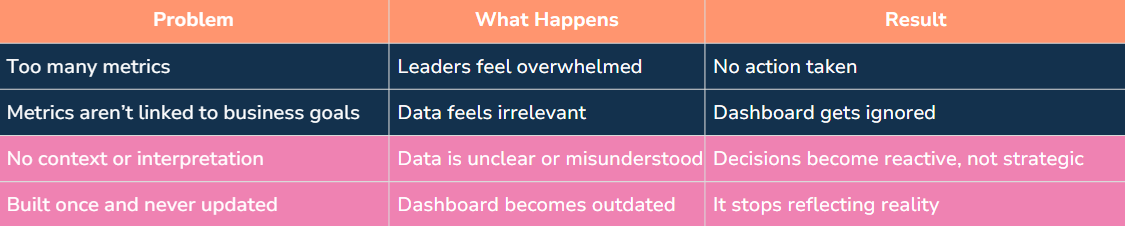
A dashboard is only valuable if it drives action. Otherwise, it’s a screensaver.
While dashboards are customized by business model, there are core financial KPIs that nearly every growth-focused business should track.
It’s not just how much revenue you have — it’s:
Questions to answer:
This reveals how efficiently the business produces and delivers value.
Low margins = operational inefficiency.
Improving margins = instant profitability lift.
Cash flow is the heartbeat of your business.
Seeing where cash will be 3–12 months from now prevents:
“How long can we keep operating at this pace before cash runs out?”
If you don’t know this number, you’re flying blind.
This is the lever that changes everything.
Once you know what’s profitable and what isn’t, you can:
This is the moment where businesses stop guessing and start scaling strategically.
A strong financial dashboard doesn’t just show numbers — it supports a reporting rhythm.
This rhythm ensures your business:
Without dashboards: “We’re growing, this is great.”
With dashboards: “One service line has negative contribution margin and is dragging total profit down.”
Without dashboards: “We probably need to hire.”
With dashboards: “Utilization rate is only 58%. We don’t need to hire. We need to restructure workload.”
Without dashboards: “Marketing is underperforming.”
With dashboards: “Lead quality from one channel dropped. Redirect budget, don’t increase or cut it.”
Dashboards remove emotion from decision-making.
At Izinga, we don’t believe in one-size-fits-all reporting.
We:
✅ Identify the right KPIs for your business model
✅ Build dashboards that are simple, visual, and actionable
✅ Tie reporting directly to revenue, margin, and cash outcomes
✅ Train your team on how to use dashboards to guide decisions
✅ Step in as ongoing financial strategy partners — not just report builders
The result? Leaders stop guessing. Teams get aligned. The business gains momentum.
A financial dashboard is only as powerful as the decisions it enables.
When your reporting system gives you:
You move differently. You lead differently. You scale differently.
If your business is growing and you’re ready to shift from operating reactively to leading proactively, the right dashboard is a turning point.
Let’s build it together.
Book a free consultation with the Izinga team.
No pressure. No pitches. Just clarity.


-p-2000%20(1).png)

.png)


